Diagrams and Maps

March 10, 2014 - 12:20am

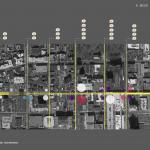
Cortez Crosby, Brittany Browne Hayes, and Chris Seifert developed this rendering of program across Crown Street in 2012. 

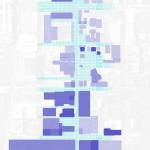
Color Code:  Grey-Vacant; Orange-Residential; Yellow-Institutional; Red-Restaurant; Brown-Nightlife/Entertainment/Bar; Dark Green-Parking;Light Green-Business; Turquoise-Retail

The diagram indicates four distinct zones of activity, with a connection drawn...

February 26, 2014 - 6:02pm
February 26, 2014 - 3:31pm

on Crown

February 26, 2014 - 3:25pm
February 26, 2014 - 3:10pm
by Amy Su
February 26, 2014 - 2:44pm
February 26, 2014 - 2:31pm

This diagram attempts to portray the extent and diversity of food establishments on Crown Street. It is an initial step towards using restaurants as a lens to explore demographic and socio-economic changes in New Haven and Crown Street.

February 26, 2014 - 2:04pm

This map/diagram is starting to explore how news influences and affects our perception of physical environments. I'm trying to set up hierarchies of space, event, news, as well as the publication venues and date of publication.

February 26, 2014 - 2:02pm

The Route 34 corridor development was an infamous part of New Haven history. Did it have residual effects on surrounding areas, specifically Crown Street? If so, how can it be measured? Here the map looks to explore the difference between pre and post corridor development. Though never fully completed, the projected relevance of the passageway in setting out a direction for the city must have...

February 26, 2014 - 1:47pm

The colors of the paint splats indicate the type of restaurant according to Google Maps, which draws supplemental data from Yelp as well as its own Google+ site. The size of the splats indicate the rating the restaurant received.

February 26, 2014 - 1:40pm
February 26, 2014 - 2:39am
February 7, 2014 - 2:20pm